SCANUM
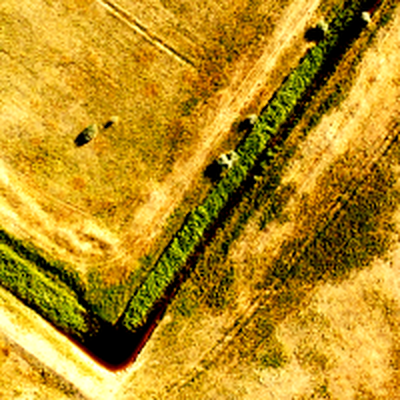
A drone survey company I co-founded. We benchmarked open-source photogrammetry tools per phase and staged the winners into a bash-scripted pipeline, turning aerial photos into a huge-resolution orthophoto, a dense point cloud locked to the site's real-world coordinates, and, when a sale called for it, a textured 3D view of the plot.
The problem
Engineering clients — design institutes, surveying firms, agricultural operators — needed survey-grade terrain models over long linear sites like pipelines and roads, and over large areas like irrigated farmland, covering many kilometres of ground per job. Getting that from a traditional ground survey meant a geology engineer walking the whole site.
What I built
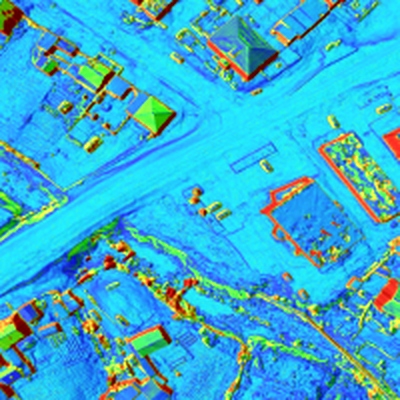
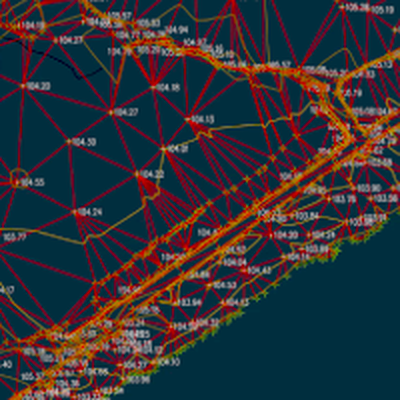
Two of us staged the job into phases with bash scripting — align the photos into an orthophoto, extract a dense point cloud from it, lock that cloud to the site’s real-world position — rather than build one tool that did the whole job. Before settling on the pipeline, we benchmarked several open-source tools against each other at each phase and kept whichever performed best; from then on, the production flow ran one fixed tool per phase, a different tool for the next phase, rather than re-comparing candidates on every job. We flew a DJI Phantom 2 and 3 at first, later a Mavic fitted with an RTK kit, and tied every flight to fixed local base points with known static coordinates, reaching about 3 mm of precision rather than floating on the drone’s own GPS. At the start we also trialled an experimental SLAM pipeline from a Swiss research group as one of the candidates benchmarked at the alignment phase. A final, optional stage rendered the orthophoto’s texture onto the dense cloud to produce a high-resolution 3D view of the plot — engineers never needed it, but it landed well as the “wow” moment in a sales pitch to a customer’s management. The core deliverables were orthophotos, TIN and elevation models, and dense point clouds, in the formats design offices import directly rather than a format they’d have to convert first. That precision, and not needing to convert anything, cut both the geology engineer’s time on site and the time spent turning surveys into project documentation.
Architecture
The diagram above traces one flight end to end: photos captured on site, aligned into an orthophoto, turned into a dense point cloud, and locked to the site’s real coordinates before export.
Key decisions
Anchor to fixed ground points, not the drone’s own GPS. A drone’s onboard GPS alone isn’t precise enough for engineering-grade output, so every flight was tied to local base points with known static coordinates. That’s what turned a good-looking model into one a design office could trust for millimetre-scale decisions.
Benchmark once per phase, then commit to the winner. No single open-source tool was reliably the best choice at every phase, so before settling on the pipeline we benchmarked several candidate tools against each other at each phase — alignment into an orthophoto, point-cloud extraction, coordinate locking — and kept running whichever tool won for that phase from then on, rather than re-comparing candidates on every job.
Trial the experimental option early, before committing. We tested an experimental SLAM-based pipeline from a Swiss research group at the start of the project, as one of the candidates benchmarked at the alignment phase, before settling on the pipeline we shipped with.
Deliver formats a design office can use immediately. Orthophotos, TIN and elevation models, and dense point clouds were chosen because they’re what an engineering office already works in — a deliverable is only useful if the client can open it without converting it first.
Save the 3D render for the room that needs the wow. Engineers worked from the orthophoto and elevation models directly; the textured 3D view was a final, optional stage kept for one audience — a customer’s sales and management team seeing the plot for the first time — not for the deliverable engineers actually used.
Results
The volumes on the company’s site today — more than 100 km of pipelines, hundreds of km of roads, dozens of bridge structures, and more than 15,000 ha of irrigation surveyed — reflect what SCANUM has delivered over its life, not just my two years there. My own first project was scanning about 500 ha of orchard land in Lebedyan, a Lipetsk-region town known for its apple orchards, used to plan planting and irrigation layout. I also worked on an irrigation project whose main supply pipe ran from a nearby river, part of the same irrigation total shown above.
Then and now
SCANUM still trades today, based in Russia and run by my co-founder. We later built a Spanish-language site to try to expand into Spain; that expansion never happened, so the company’s real work has stayed where it started. My own part was the first two years: building the pipeline that combined several imperfect tools into one dependable one, and running the early projects on it. I have no ownership stake or ongoing role in the company today.
What I’d do next
If I were doing this again today, I’d keep better records as I went, so a question like this one wouldn’t come down to memory eight years later. I’d also want to revisit how we benchmarked and settled on a tool for each phase back then: that was a fixed set of heuristics, not a rigorous methodology, and I’d want to test whether that decision can be made better today.